R12.3-2026Apr21
Define Automation to Monitor Network devices on the Map
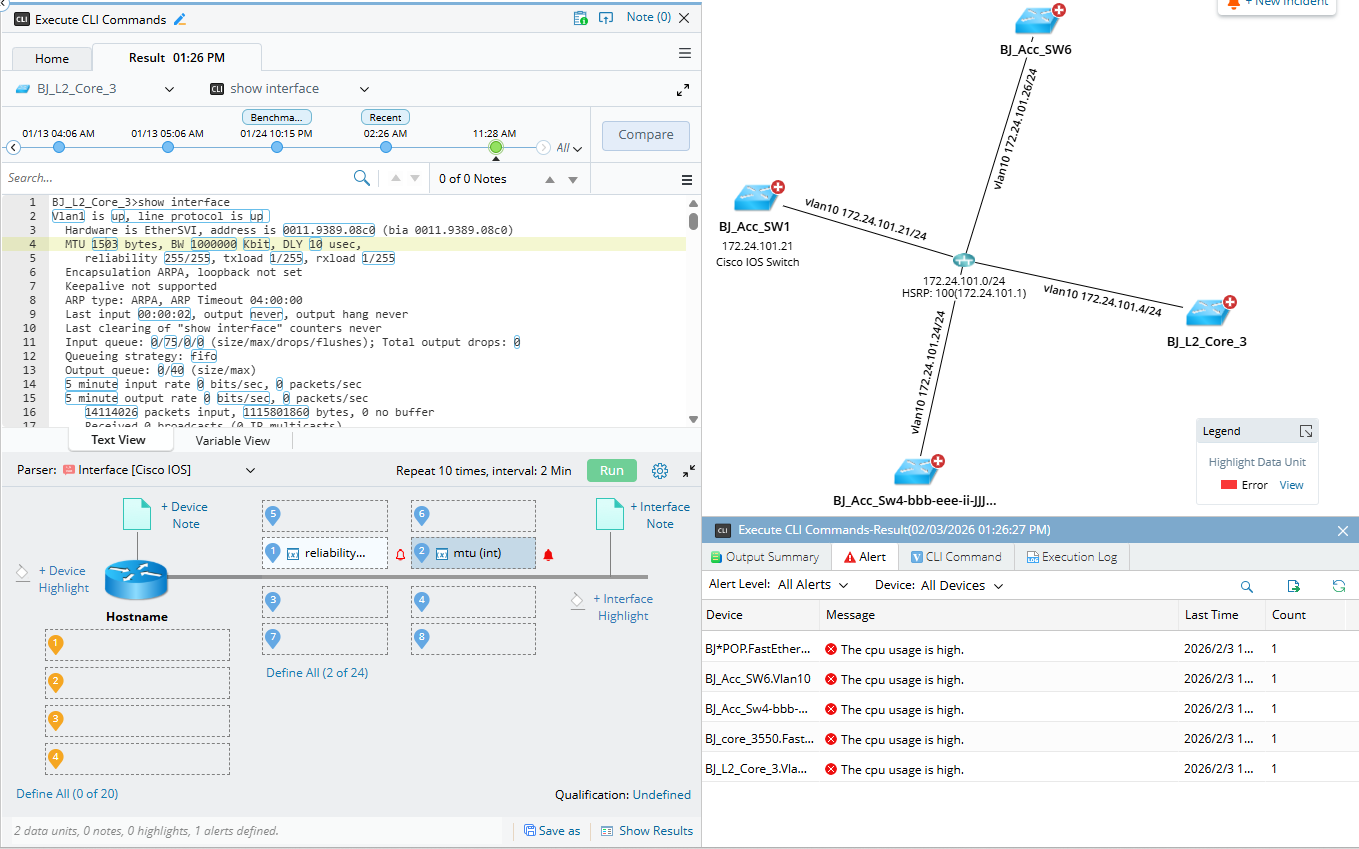
After the CLI command execution is finished, you can define a CLI automation to monitor network variables directly on the map. Follow these steps:
- Click the icon in the lower-right corner to open the automation pane. Then select a Parser: Choose a parser from the list to analyze CLI command outputs.
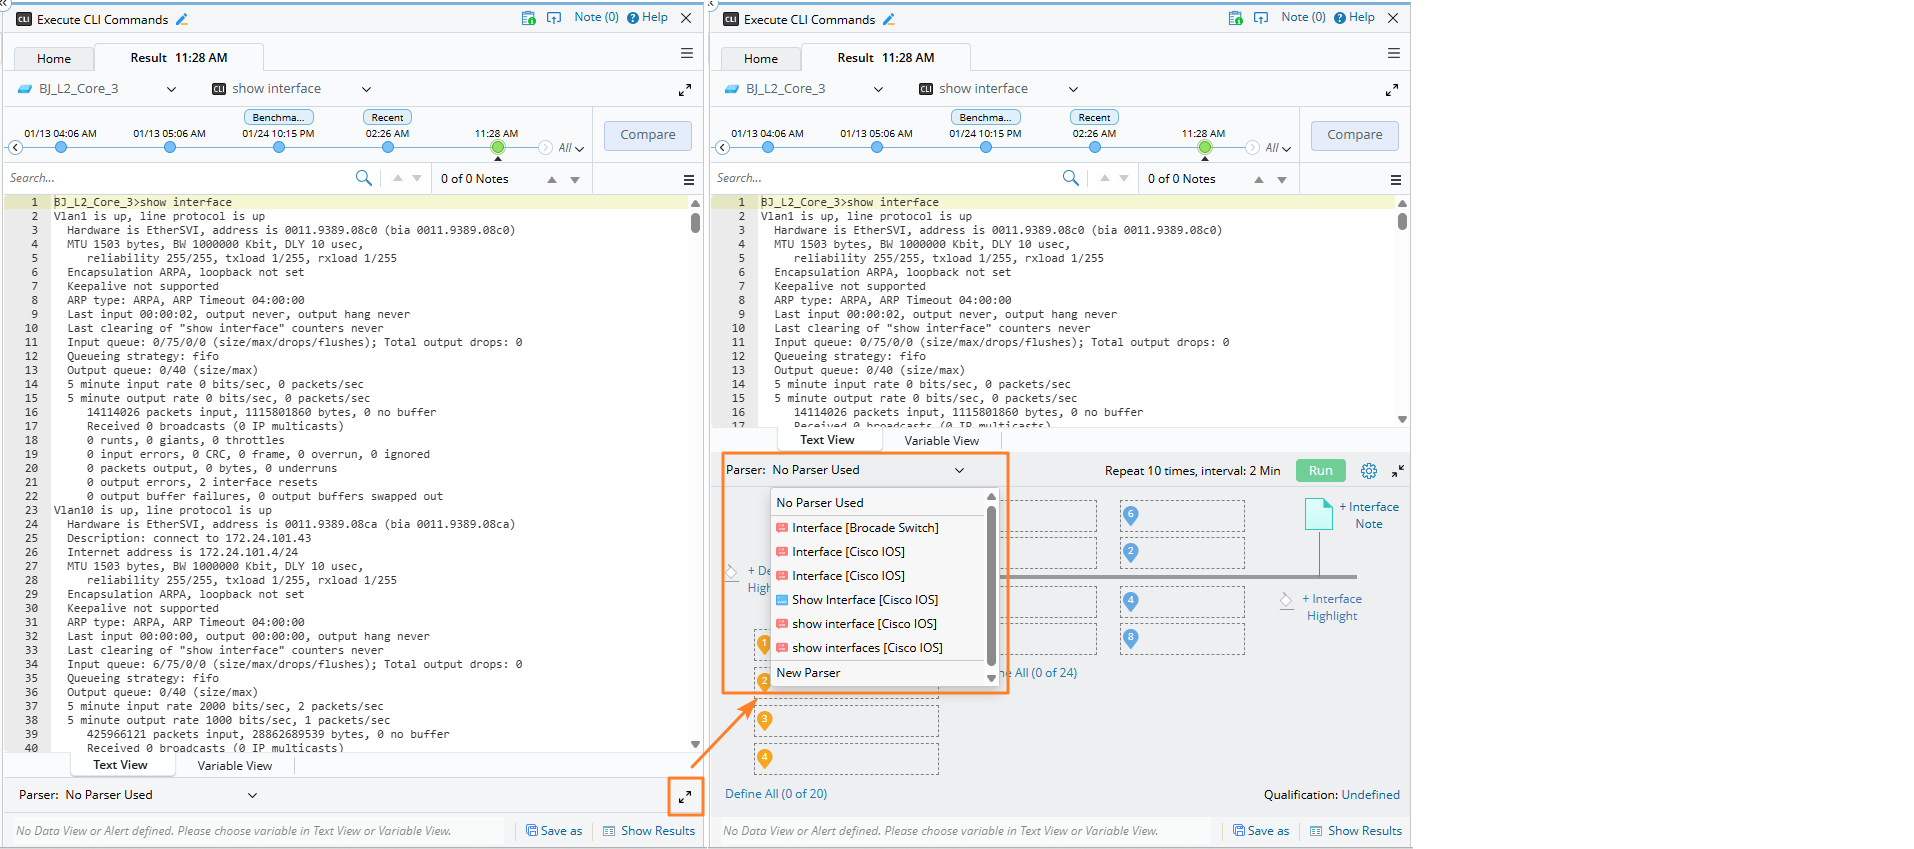

Tip: The system uses the device types of all target devices and specified CLI commands to search for matching parsers from the Parser Library.
- If multiple parsers match, they are populated in the list for manual selection.
- If only one parser matches, it is automatically selected.
-
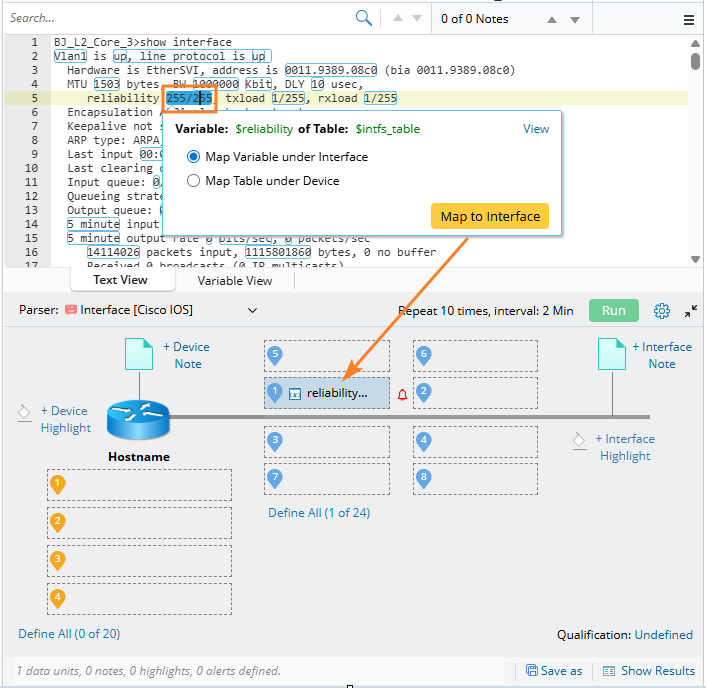
Map and Configure: Click on a number value and then select Map to Interface to expand the definition area and configure how the automation is applied.
-
Define Alerts and Device Highlight: When these are defined, they will be displayed on the map, it will be displayed when the value deviates from the defined threshold or condition.
-
Click the Alert
 icon next to the device variable to define alert criteria. Then click OK to apply. Refer to Define Alert for detailed information.
-
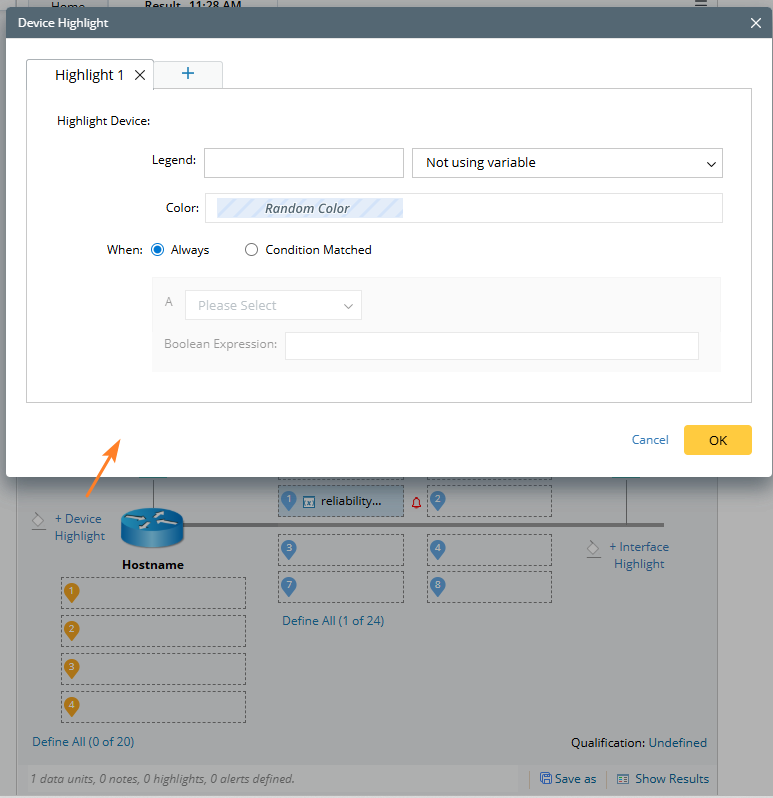
Click Device Highlight to apply a random color to highlight the corresponding device on the map. Refer to Define Device and Interface Highlight for more details.
-
Click the Alert
-
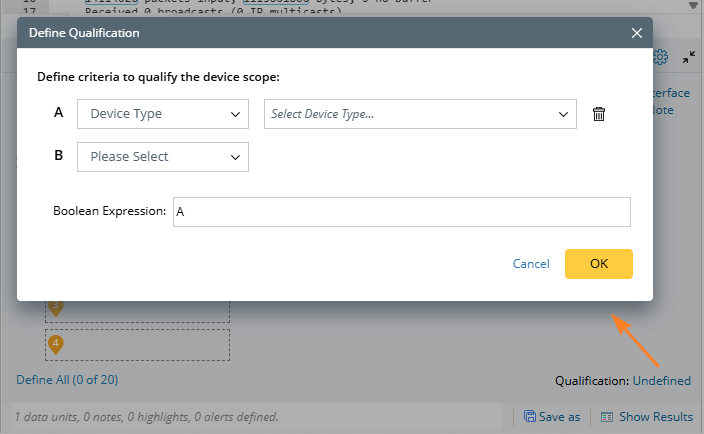
Define Qualifications (Optional):
- Click Target Device Qualification to set criteria that refine the scope of the automation.
-
By default, no qualification is defined, so the CLI automation applies to all devices on the map. You can define qualifications to ensure the automation only targets specific devices that meet the criteria.
-
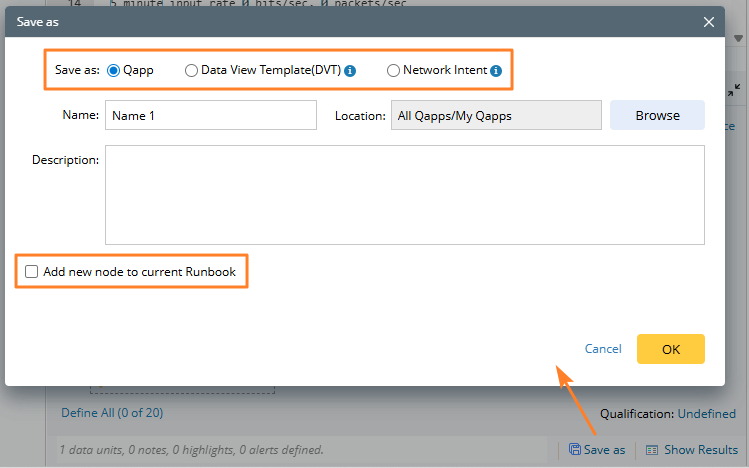
Save or Reuse the Automation: Click Save As to:
- Save the automation as a Qapp or Data View Template, or
-
Add it directly as a Qapp or Data View Template node to the current Runbook.
-
Run the Automation: Click Run to execute the automation and monitor the defined variables on the map in real time.