10.1.9 JA Publication
Test and Save the Triggered Diagnosis
- Click Test in the Configure Triggered Automation for ADT window.
- In the Test Diagnosis window, define the following settings:
- Input the data fields to emulate the API call:
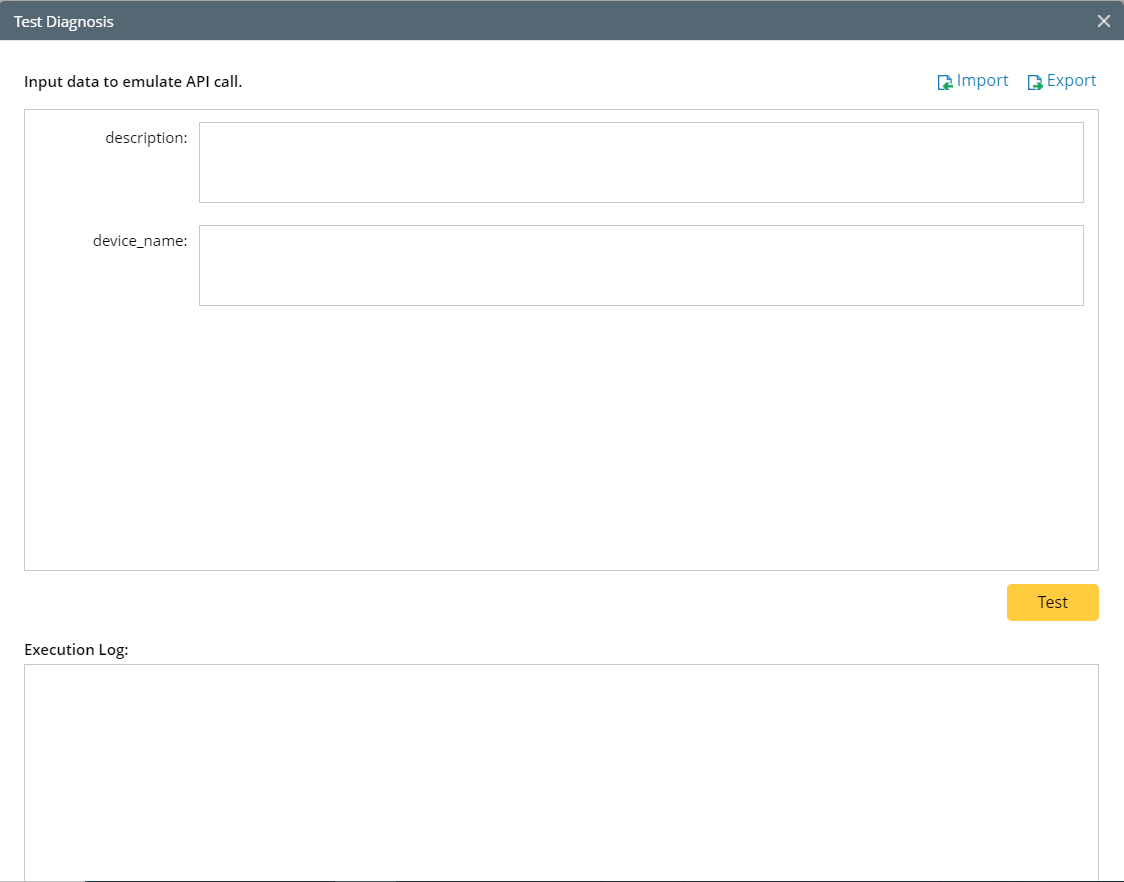
- Description: Input the Description for the potential network issue.
- Device_name: Enter the device name of problem device.
- Click Test to test the Diagnosis to determine if the Diagnosis if properly defined.
- Input the data fields to emulate the API call:
- The system prints out the execution log with the following outputs:
- The results of Incident type.
- Matched triggered Diagnosis.
- Match intent for ADT.
- NI execution results if execution mode includes the execution of NI.
- The message “Created map incident message.” if the execution mode includes the Intent Map. Likewise, the map note is displayed if the corresponding option is selected.
- Incident devices if Set Incident Device option is set.
- Incident message if the option is enabled.
- Whether the incident message is successfully created by the Guidebook or Runbook template if the corresponding option is selected.
- Whether the subscription to preventive automation is successfully enabled if it is configured.
A View Result in Incident button is provided to view the Incident for this incoming call.
- Click Close to close the Test Diagnosis window.
- In the Configure Triggered Automation for ADT window, click OK to save the triggered diagnosis.