Viewing Triggered Diagnosis Log

Contents
To view the triggered diagnosis log:
1.Click  and select Intent-Based Triggered Automation.
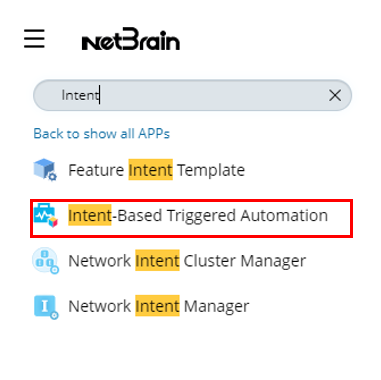
2.Navigate to the Diagnosis Log pane. By default, logs of all triggered Diagnoses are listed.
3.Filter the diagnosis by the time range and status.

The diagnosis :
• Auto trigger diagnosis by the Integrated IT systems
• Manually triggered Diagnosis from the Integrated IT systems
• Manually triggered maps from the Integrated IT systems
• Manually triggered Diagnosis from NetBrain Incident Portal
Each task has the following fields:
• Triggered Task ID
• Source: integrated IT system, NetBrain, or Incident Portal
• Category: the Integrated IT system category or empty if it is from NetBrain Incident.
• Triggered time.
• The tasks status: Pending, Running, Finished, aborted, or Failed.
• Incident type: can be none if no Incident type is matched.
• Incident ID: none if no Incident is matched.
• Matched diagnosis count: the number of diagnoses triggered by this task.
• Log: view the execution log of this task.
