View Detail Pane for All Nodes
A detail pane is provided for most nodes of the diagnosis tree to display the detailed information so that users can get all data without leaving the diagnosis tree pane. The following table shows whether a detail pane exists in the pre-execution and post-execution mode:
| Details Pane for | Pre-execution Mode | Post-execution Mode |
| Start Node | N — No start node before executing. | Y |
| NI Node | Y | Y |
| Device Node | Y | Y |
| Diagnosis Node | Y | Y |
| Stop Node | Y | Y |
| NIC Node | Y | N — Only show the NI nodes of matched member intents in the NIC. |
| Call Qapp Node | Y | Y |
| ADT Node | Y | N — Only show the ADT intent nodes. |
Start Node
The start node is only available after execution, so it only exists in post-execution mode.
- The details of the Start node are displayed as follows:
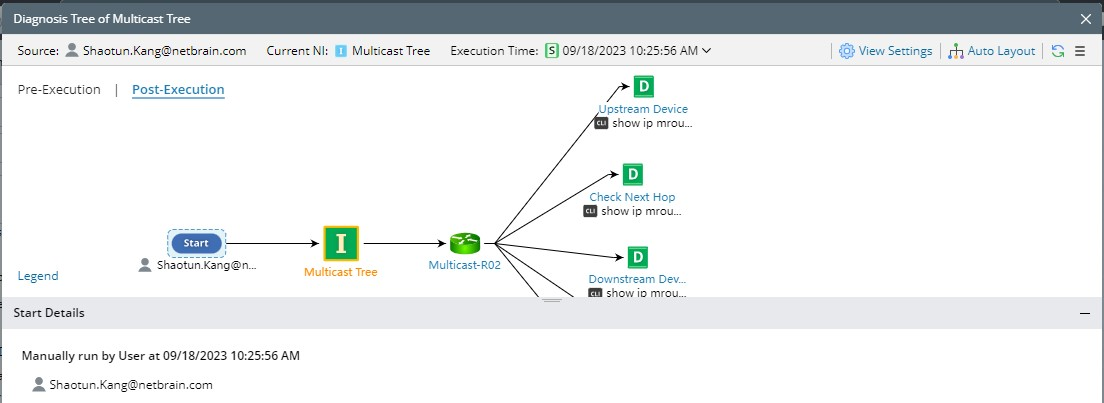
Execution Type Information in Detail Pane Manually
Note: Triggered by API Stub and Triggered by Event Template are also classified as Manually.
Manually run by user: $username
Triggered by Incident Triggered by Incident:$incident_id + $incident_nameTriggered by Probe Triggered by Probe:$device name$probe name
NI Node
NI node exists in both pre-execution and post-execution modes. The NI detail is displayed here . 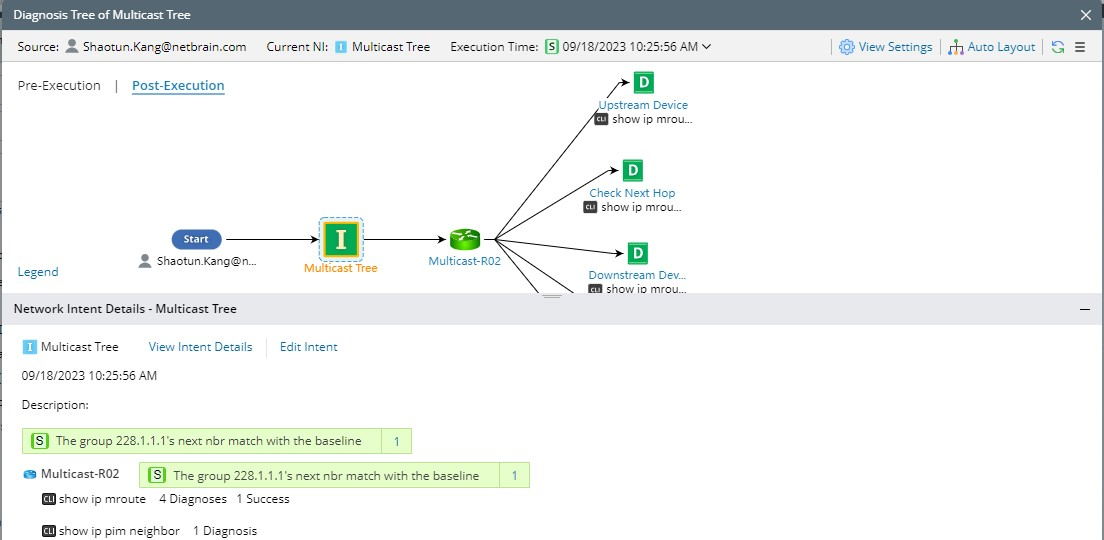
Details Pane of NI Node in Post-Execution Mode
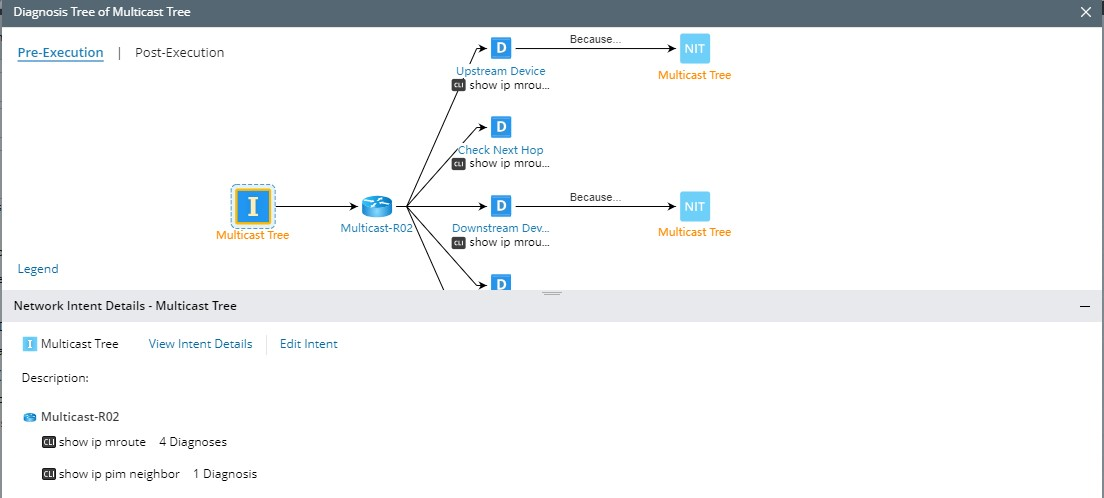
Details Pane of NI Node in Pre-Execution Mode
- The status code is not displayed in the pre-execution mode but is shown in the post-execution mode.
- Only one status code at the NI level is displayed. Users can click … to view more status codes.
- Only display the devices and commands, but not the diagnosis details.
- Provides additional entrances of “View NI Details” and “Edit NI”, which can open the View NI dialog and Edit NI dialog, respectively.
- Does not show additional drill-down actions and the operations such as running NI, opening the diagnosis tree, or comparison dialog.
Device Node
The device node exists in both pre-execution and post-execution modes. It has the same function in these two modes, displaying all properties of the corresponding device and the CLI command or configuration data in the baseline of the current device.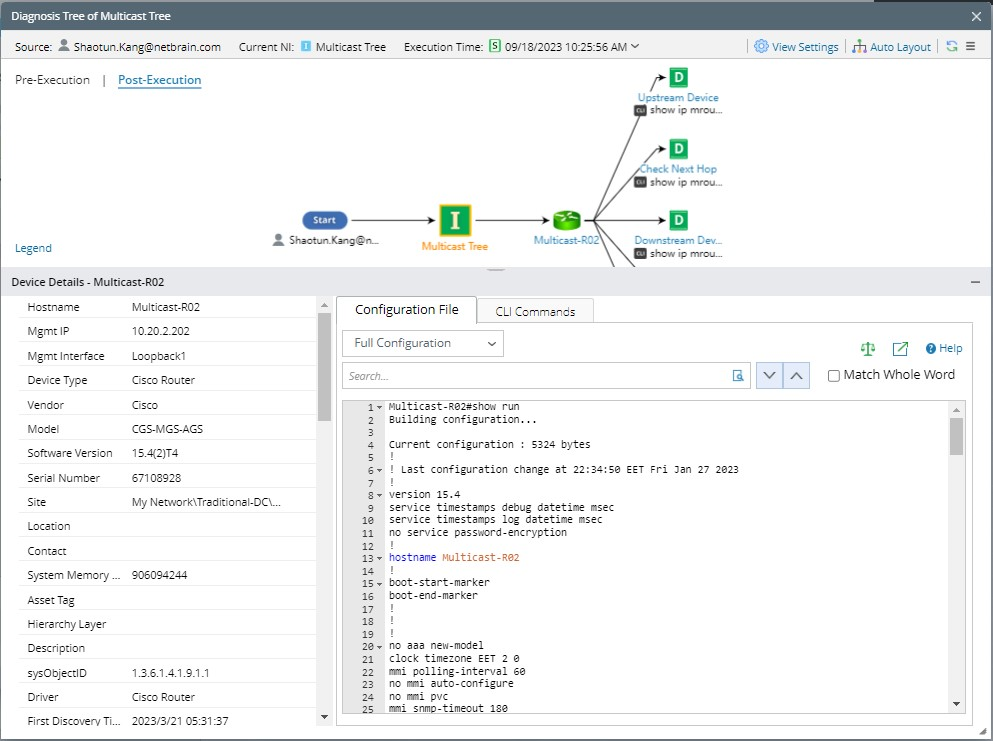
Details Pane of Device Node
Only the configuration and CLI commands in the baseline are displayed, and you can view them directly or open a pop-up dialog to view them.

|
Note: Since the device data shown here is the original data, it is also controlled by the permissions of the Device Access Control, and the logic is consistent with that in the Device Details pane. |
Diagnosis Node
The diagnosis node exists in both pre-execution and post-execution modes, displaying the details of the diagnosis and providing the entrance of Comparison.
The details pane of the Diagnosis node in the post-execution mode is as follows: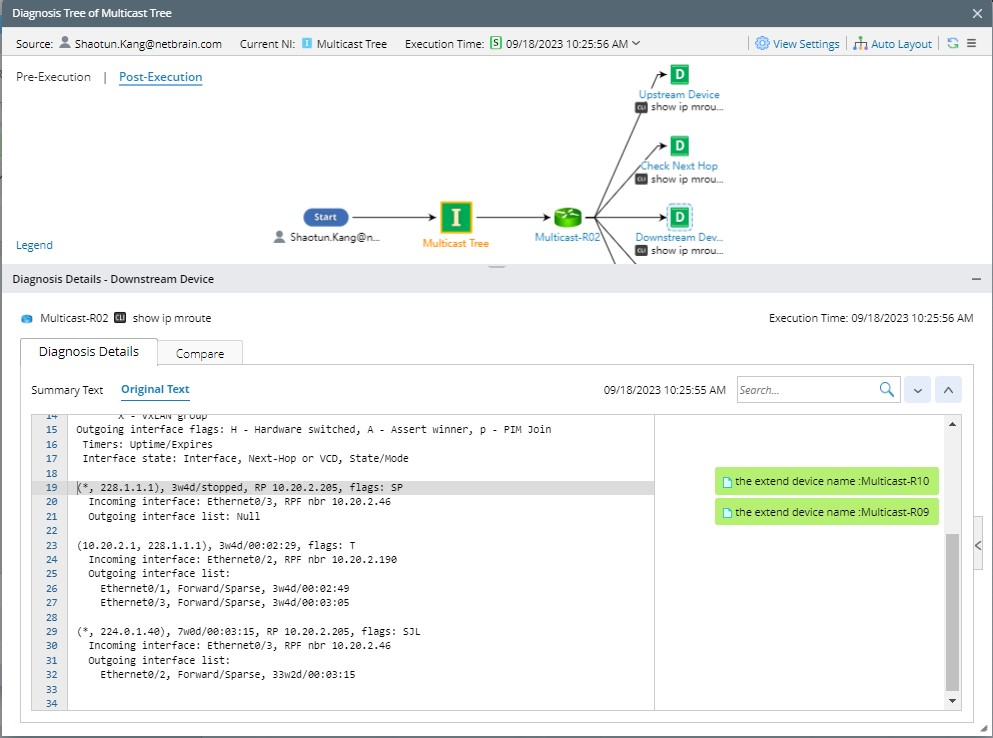
The details pane of the diagnosis node in the pre-execution mode does not show the status code but the diagnosis name. The Diagnosis Logic pane will always show the wording “No Data Available”. 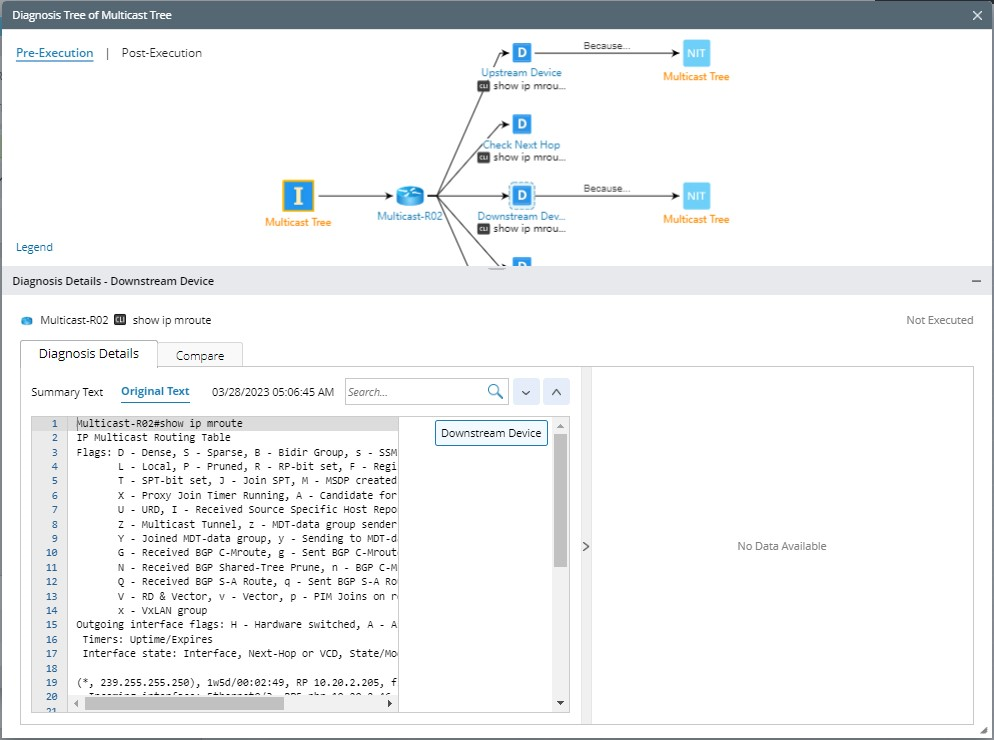
Stop Node
Stop node exists in both pre-execution and post-execution modes, displaying the summary of the Stop defined in diagnosis.
- Belong to: Show which intent and device the Stop node belongs to and under which diagnosis it is defined.
- Be Executed: Show whether the current Stop node is executed. No means that it is not executed, while Yes means it has been executed, which is only displayed in the post-execution mode.
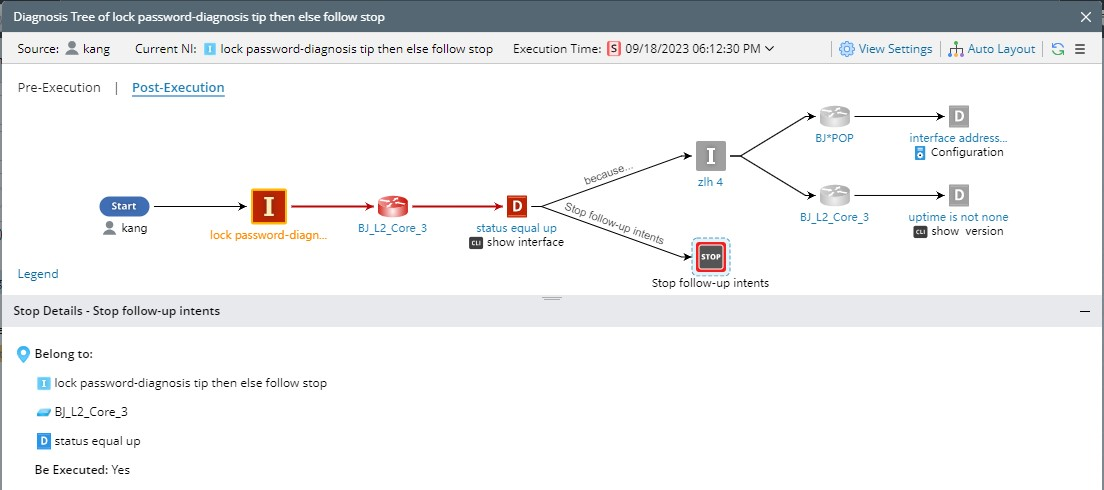
Details Pane of Stop Node in Post-Execution Mode
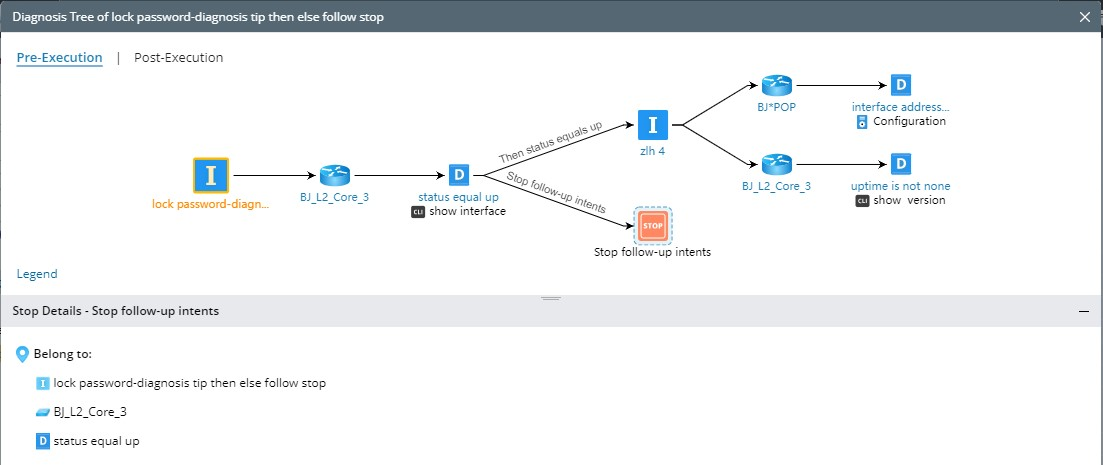
Details Pane of Stop Node in Pre-Execution Mode
NIC Node
The NIC node will be shown in the pre-execution mode. Therefore, a details pane for the NIC can also be reviewed.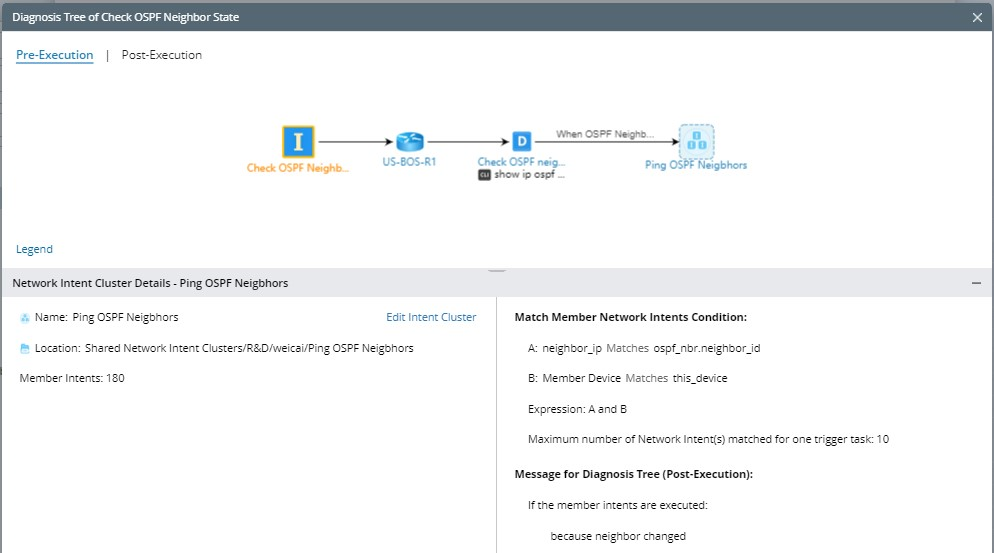
The details pane provides the following information:
- NIC name, description, and location.
- Entry to Edit Network Intent Cluster. Click it can open the NIC manager directly and open the corresponding NIC for browsing and editing.
- Member Intents, displaying the total number of member intents contained in the NIC.
- NIC matched conditions, displaying the conditions for executing the NIC defined in Follow-up NIC, (how to select member NI in the NIC to run) and the messages displayed when it is executed or not executed.
Note: When there is too much information to display completely, users can scroll the vertical scroll bar.
In the post-execution mode, the member NI that satisfies the conditions and has been executed will be displayed, and its details pane is the same as a common NI.
Call Qapp Node
The Call Qapp node exists in both pre-execution and post-execution modes. You can view the details pane in diagnosis tree.
ADT Node
The ADT node can be displayed in the pre-execution node, and in the post-execution mode, only show the ADT intent nodes.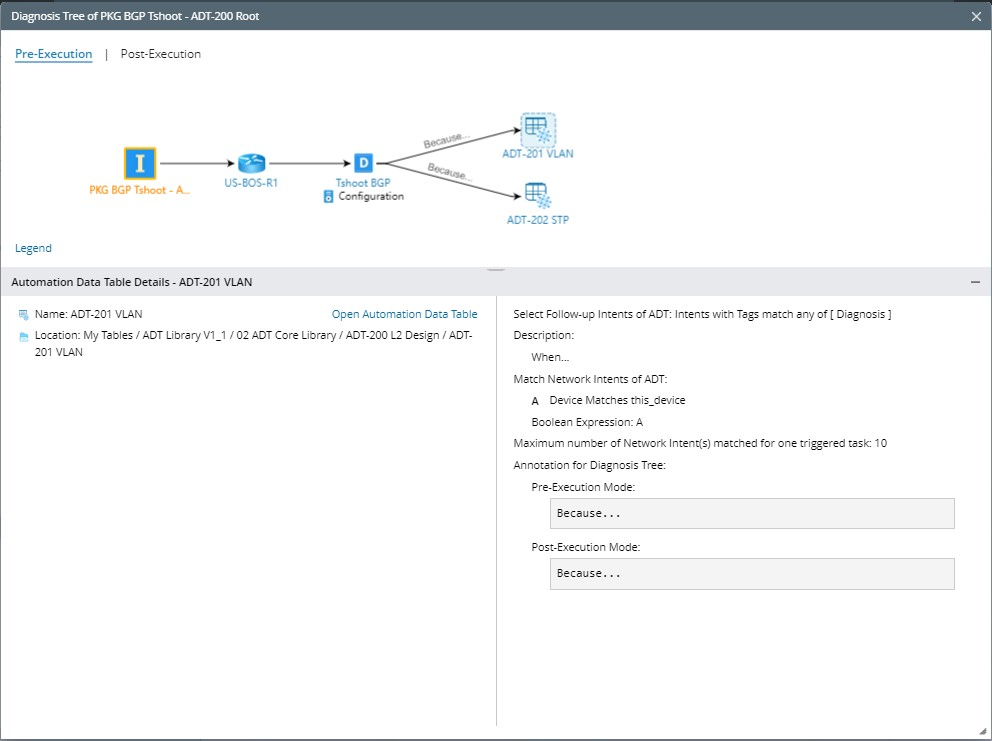
Details Pane of ADT Node in Pre-Execution Mode
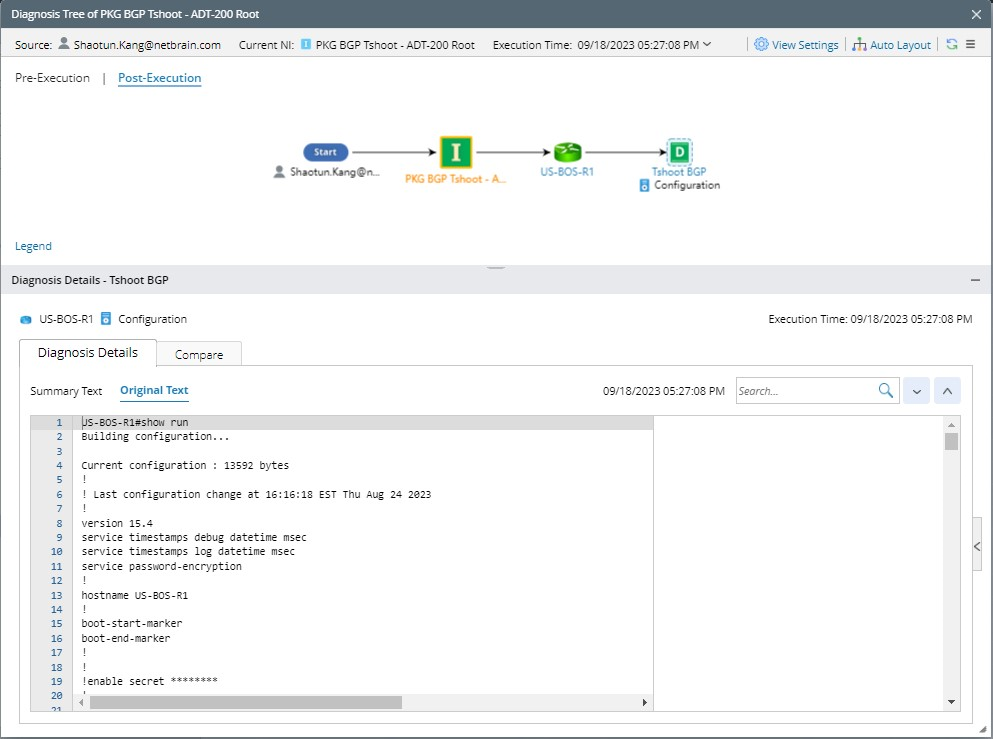
Details Pane of ADT Intent Node in Prost-Execution Mode