R12.3-2026Apr21
CVE Automation - Observability Dashboard
The observability dashboards are placed in the CVE Security Advisory folder. You can locate them by clicking the start menu, and navigating to Intent-Based Automation > Observability Dashboard > the All tab> the Observability tab> Shared Dashboards folder > CEV Security Advisory folder.
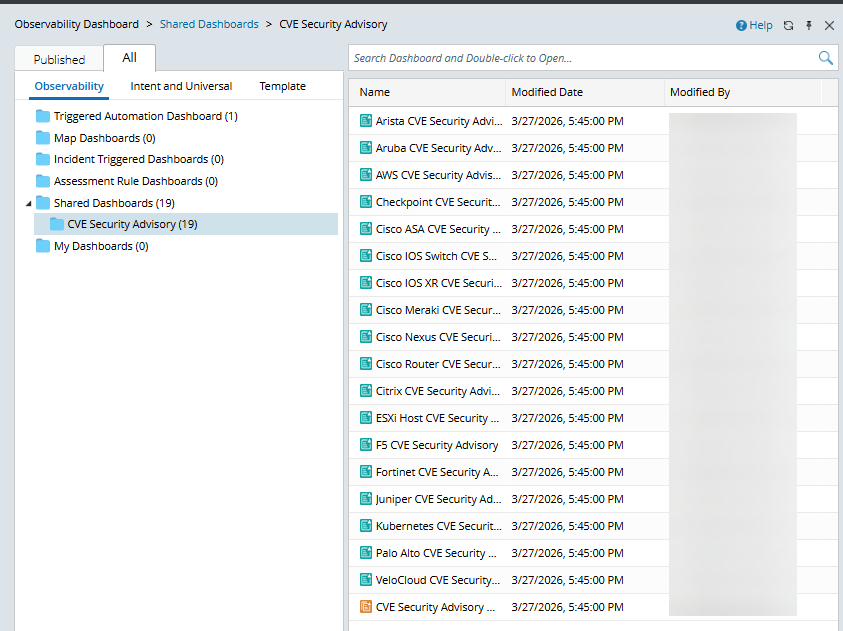
The folder contains a network-wide CVE security observability dashboard and CVE Security Advisory observability dashboards for each device type.
-
Device-type specific dashboards.
Example: Cisco IOS Switch CVE Security Advisory
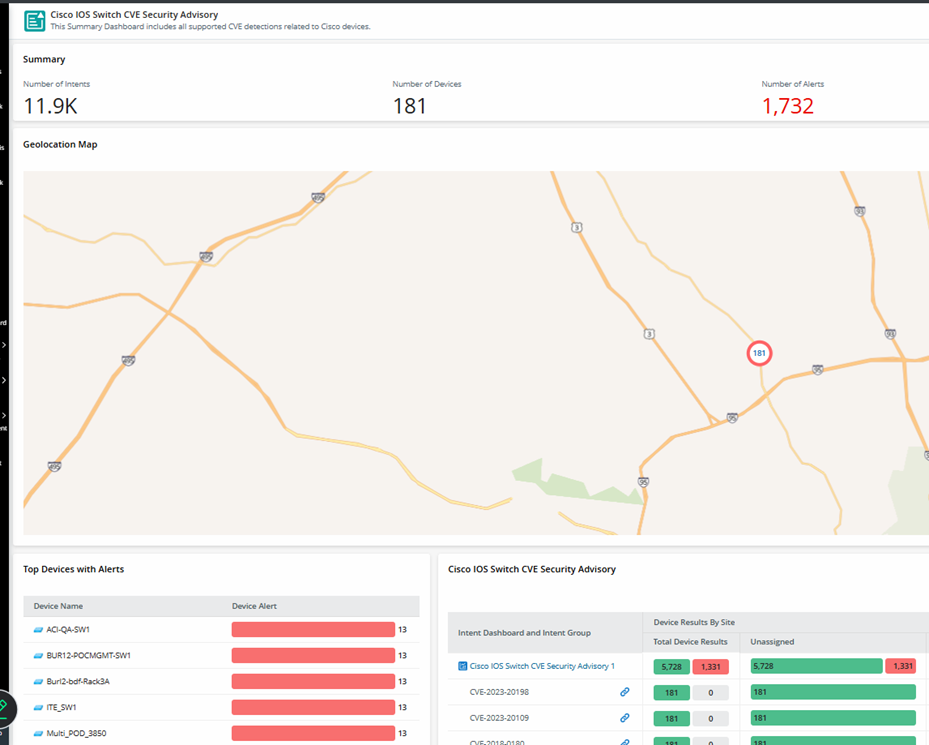
- You can export the dashboard as a summary of each device type's CVE checks. It can be archived/shared and modified using AI.
-
Offline users can hover over each CVE ID to view its description.

-
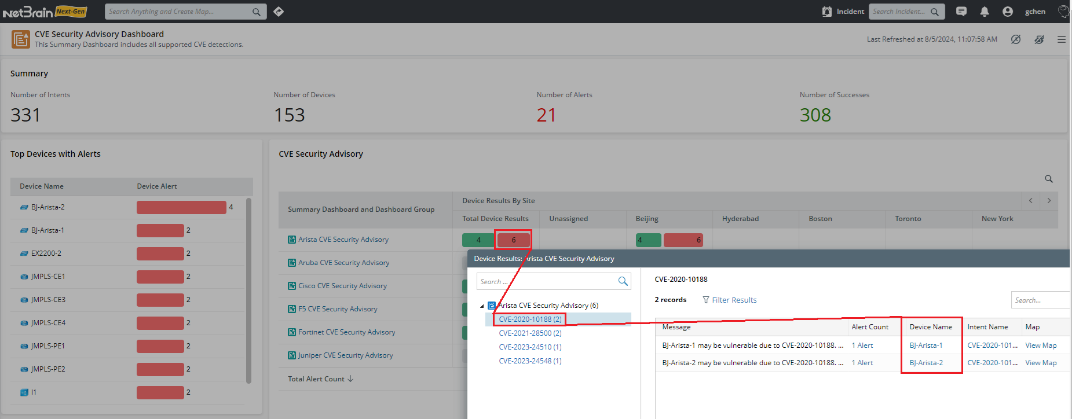
CVE Security Advisory Dashboard is a network-wide observability dashboard.
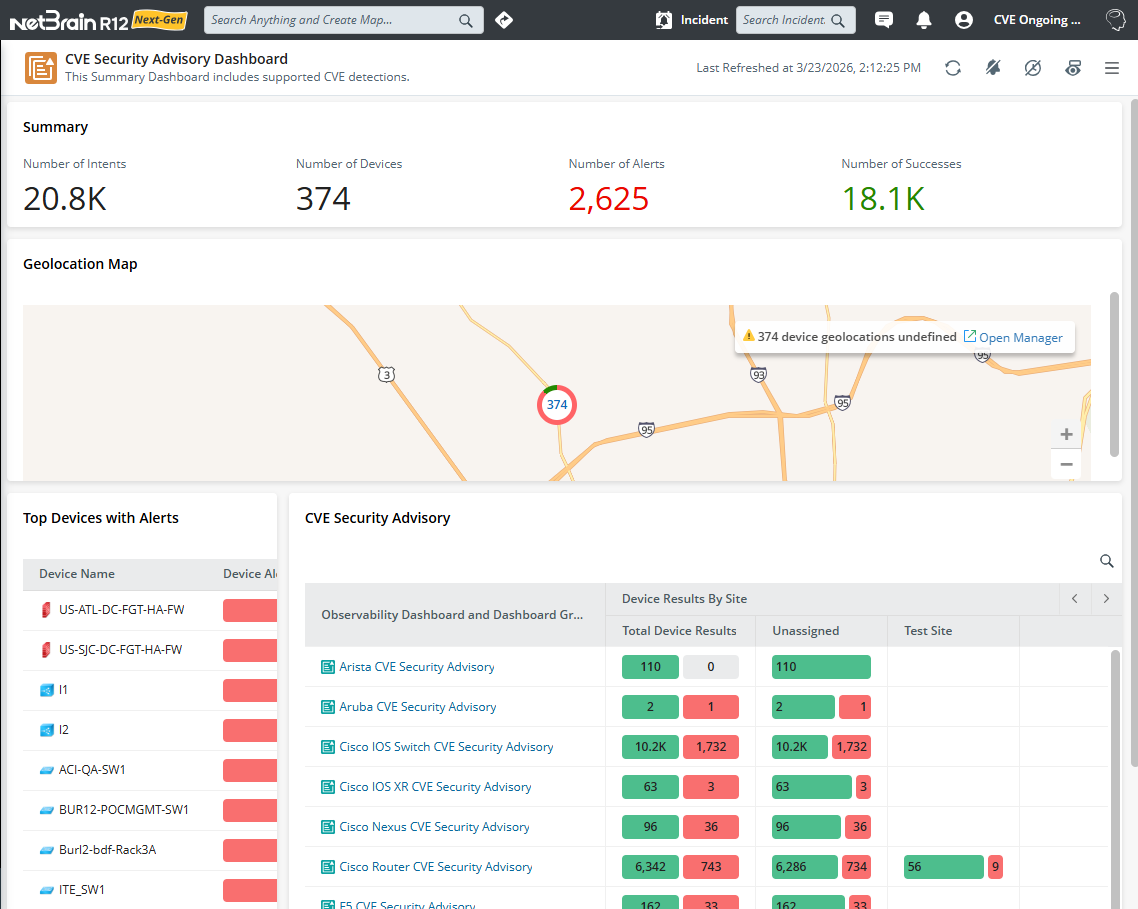
This observability dashboard provides a comprehensive overview of the CVE-related network intent results for network-wide devices. It is an observability dashboard created with all device types’ observability dashboards.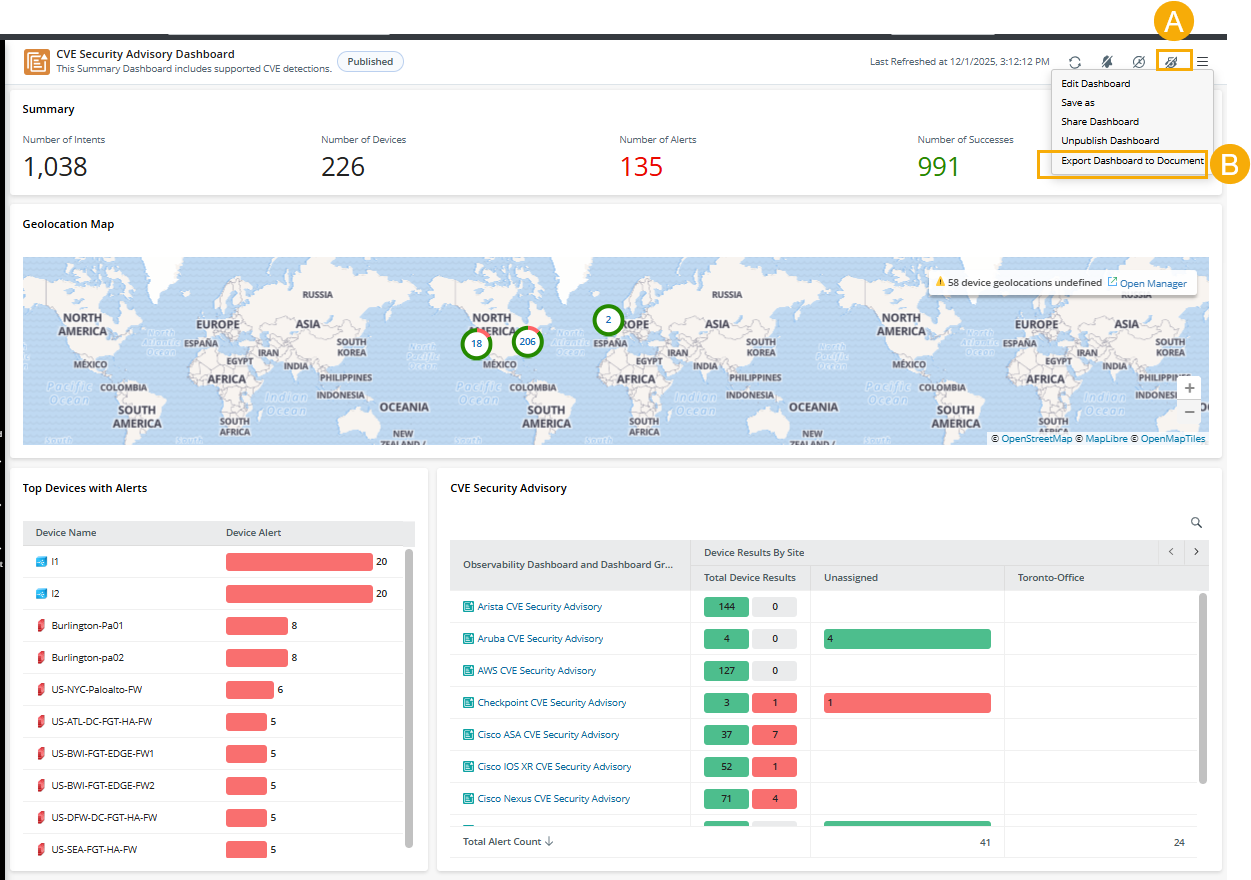
- Click
 to show all rows, including vendors with no data, displaying all vendors.
 - Export the results of all network-wide CVE checks to archive the report or share them for collaboration. You can also use AI to optimize the report.
- You can view the results from the following two dimensions:
- By Device: See how many CVEs have detected issues with each specific device.
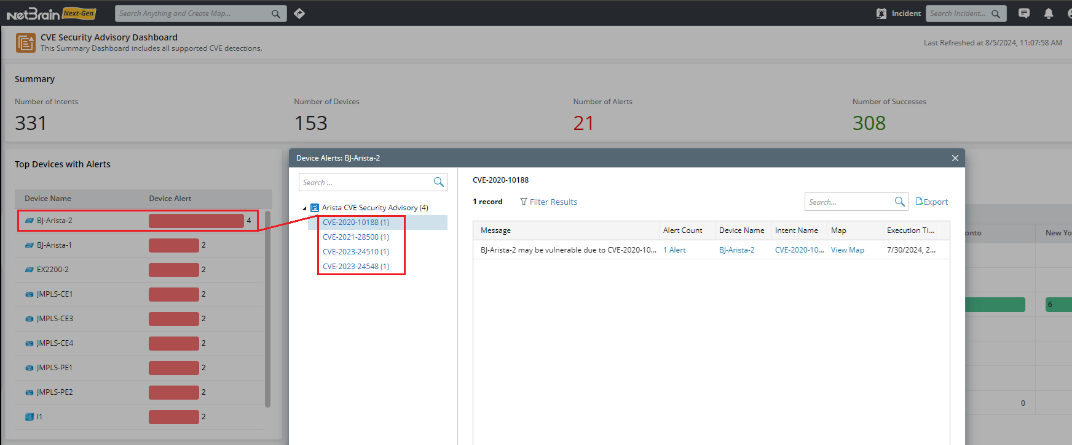
- By CVE: See how many devices have been affected by each specific CVE.
- By Device: See how many CVEs have detected issues with each specific device.
- Click