View Automation Usage
Automation Usage provides a consolidated view of how automation features are used across the system. It displays usage statistics for dashboards, runbook templates, intents, golden rules, and other automation assets, along with user login and license information.
From this page, you can quickly understand overall automation adoption, such as how many automation assets exist, how frequently they are executed, and how users interact with automation features during the current week and over time. Detailed metrics help you analyze usage trends for dashboards, runbooks, intents, and Golden Engineering Studio (GES) rules.
Click the  icon from the Quick Access Toolbar, then select Domain Summary from the drop-down menu to view automation usage.
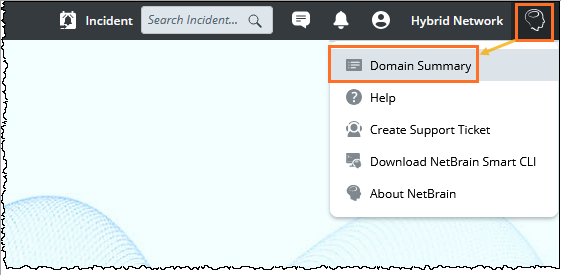
The Automation Usage pane opens as follows: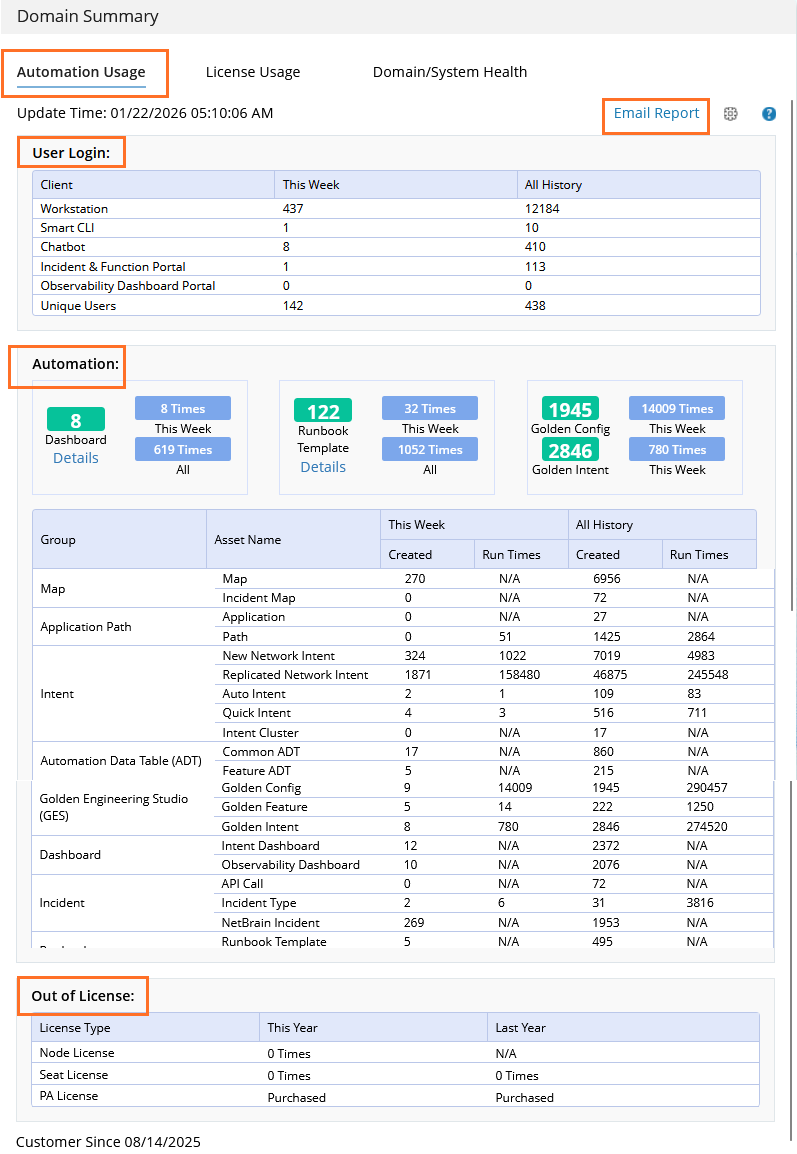
The Automation Usage tab includes:
 |
Note: The data for this week is counted from Monday this week to the day the report is created. The data for the week is updated each hour. |
User Login Matrics
This block shows the user login data via different applications or portal for This Week and All History. 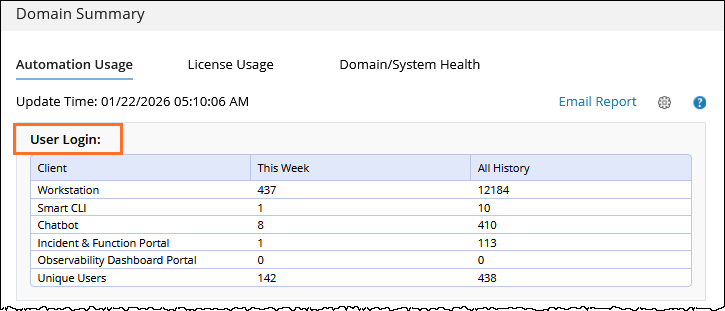
Automation Usage Metrics
The Automation Metrics page includes the following metric blocks:
-
Published Dashboards
-
Published Runbook Templates
-
Golden Config and Golden Intent
Each block displays usage statistics for the current week and historical totals.
Published Dashboards Metrics
The Published Dashboards block displays usage statistics for published Observability dashboards.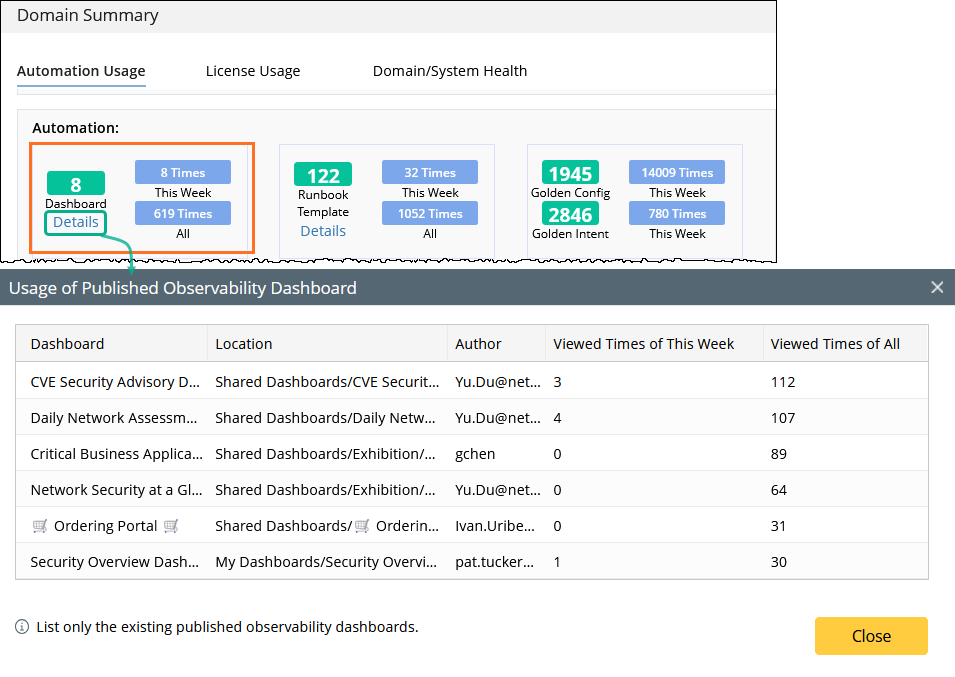
Metrics Shown in the Block:
-
Total Count - Displays the number of published Observability dashboards that currently exist.
-
Viewed This Week - Displays the number of times published dashboards were opened during the current week.
-
Viewed (All) - Displays the total number of times published dashboards have been opened.
Note: View counts include dashboards that were previously published but are now unpublished or deleted.
View Dashboard Usage Details:
Click Details to open the Usage of Published Observability Dashboard dialog. In this dialog, you can:
-
View each published dashboard and its usage statistics
- View the dashboard location path and author
-
See Viewed Times of This Week and Viewed Times of All
-
Sort the list by clicking a column header
Note: Only existing published Observability dashboards are listed.
Published Runbook Template Metrics
The Published Runbook Templates block shows how often published runbook templates are used.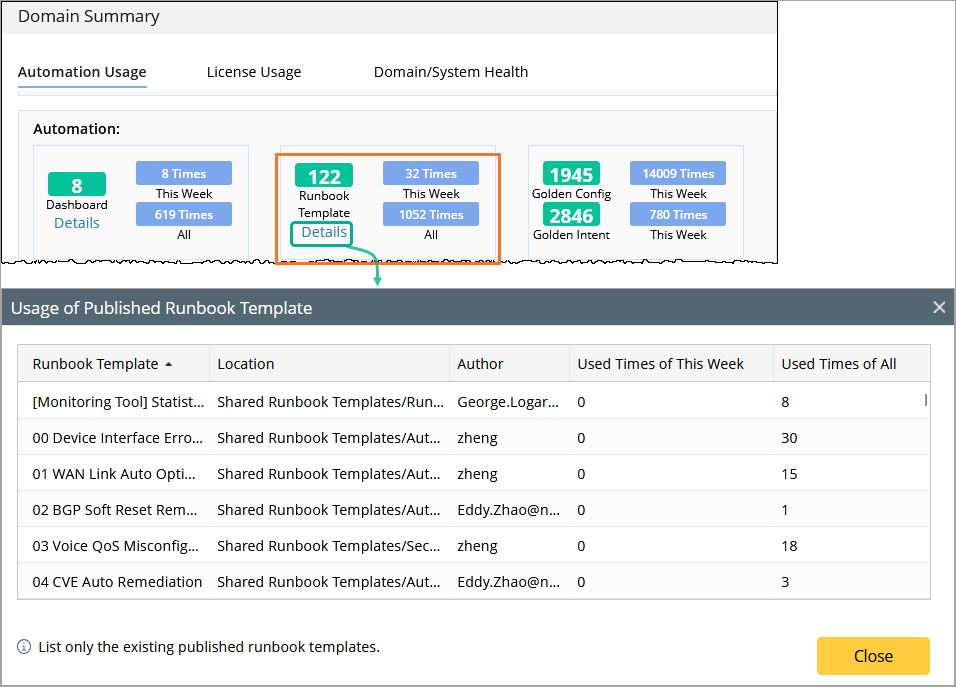
Metrics Shown in the Block:
- Total Count – Displays the number of published runbook templates that currently exist.
- Used This Week – Displays the number of times published runbook templates were used during the current week.
- Used (All Time) – Displays the total number of times published runbook templates have been used.
View Runbook Template Usage Details:
To view usage details for individual runbook templates, click Details to open dialog.
Click Details to open the Usage of Published Runbook Template dialog. In this dialog, you can:
View each published runbook template and its usage statistics
-
See Used Times of This Week and Used Times of All
-
Sort the list by clicking a column header
-
View the template location path and author
Golden Config and Golden Intent Metrics
The Golden Config and Golden Intent block displays summarized usage statistics.
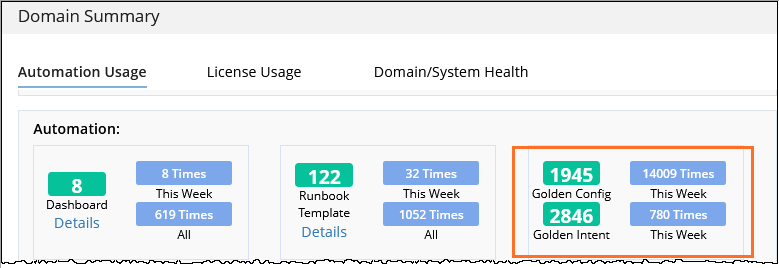
Golden Config Metrics:
-
Total Count - Displays the number of Golden Config rules.
-
Run Times (This Week) - Displays the number of times Golden Config rules were executed during the current week.
Golden Intent Metrics:
-
Total Count - Displays the number of seed Golden Intents.
-
Run Times (This Week) - Displays the number of times cloned Golden Intents were executed during the current week.
To provide accurate data, the system displays automation usage statistics for each function, including the number of automation objects created and the number of times they are run.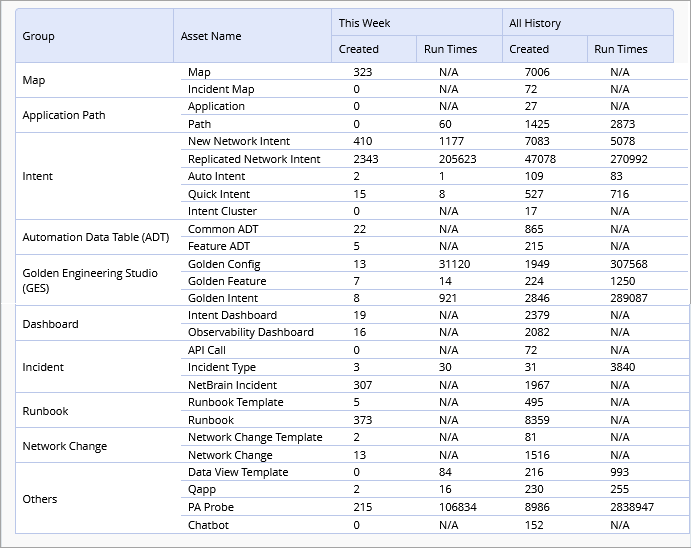
The metrics included in Automation Usage report cover the data of interactive automation, preventive automation and triggered automation, and the main metrics are summarized in the table below.
| Group | Metrics | Description |
| Map | New Map | Total number of maps, excluding Incident Maps. |
| Incident Map | Number of maps generated when an incident is triggered. | |
| Application Path | Application | Total number of applications, including both triggered and manual. |
Path | Total number of paths, including both triggered and manual. | |
| Intent | New Network Intent | Total number of network intents, excluding replicated intents. Scheduled runs are included. |
| Replicated Network Intent | Replicated intents, including cloned and member intents. Golden Intents are excluded. | |
| Auto Intent | Created: Number of Auto Intents created. Run Times: Number of times Auto Intents were run. | |
| Quick Intent | Created: Number of Quick Intents created. Run Times: Number of times Quick Intents were run. | |
Intent Cluster | Created: Number of intent clusters created. Run Times: Not applicable. | |
| ADT | Common ADT | Created: Number of Common ADTs created. Run Times: Not applicable. |
Feature ADT | Created: Number of Feature ADTs created. Run Times: Not applicable. | |
| GES | Golden Config | Created: Number of Golden Config rules created. Run Times: Number of Golden Config checks executed, including test runs. |
Golden Feature | Created: Number of Golden Features created. Run Times: Number of Feature Discovery executions, including test runs. | |
Dashboard | Intent Dashboard | Created: Number of Intent Dashboards created. Run Times: Not applicable. |
Observability Dashboard | Created: Number of Observability Dashboards created (includes both published and unpublished). Run Times: Not applicable. | |
Incident | API Call | Number of third-party API calls. |
Incident Type | Number of incidents, including incoming and virtual. | |
NetBrain Incident | Total number of NetBrain incidents, including triggered incidents. | |
Runbook | Runbook Template | Created: Number of runbook templates created, including built-in templates. Run Times: Not applicable. |
Runbook | Created: Number of runbook instances created. Run Times: Not applicable. | |
Network Change | Network Change Template | Created: Number of network change templates created, including built-in templates. Run Times: Not applicable. |
Network Change | Total number of network changes, including triggered and manual. | |
| Others | Data View Template | Run times exclude scheduled executions. |
Qapp | Run times include scheduled executions. | |
PA Probe | Looking Glass probes are excluded. | |
Chatbot | Run times are counted. |
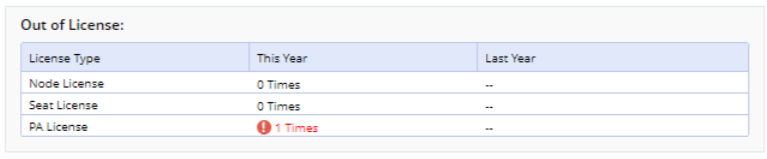
Out of License Summary
You can check how much intent quota is left, and how many times the limitation of the license has been exceeded in the Out of License block.
The Out of License Summary (the accumulated times of using PA license beyond license limit) for this year and last year is displayed.
- Out of License Summary (PA license is purchased):
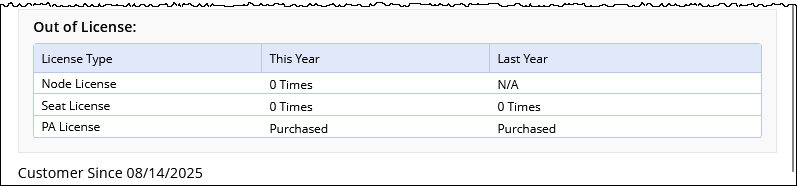
- Node License: Displaying how many times you discovered more devices than the node license. The system allows you to discover more devices than the node license. The devices exceeding the node license are listed with limited functions.
- Seat License: Displaying how many times users failed to login due to insufficient seat license.
- PA License: "Purchased" is displayed. PA license is purchased, and you do not have the limitation to execute the intent.
- Out of License Summary (PA license is not purchased):
- Node License: Displaying how many times you discovered more devices than the node license. The system allows you to discover more devices than the node license. The devices exceeding the node license are listed with limited functions.
- Seat License: Displaying how many times users failed to login due to insufficient seat license.
- PA License: Displaying how many times users have used PA license quota after the quota runs out.
- General Rules of License Summary:
- The out of license data for last year will not be influenced by license conditions for this year.
- After upgrading NetBrain to a new version, the exceeding Node License/Seat License/PA License data will be cleaned.
- Afte PA license is purchased, the Out of License data for PA license will be cleaned.
Report Automation Usage Via Email
The system supports sending your automation usage report via email.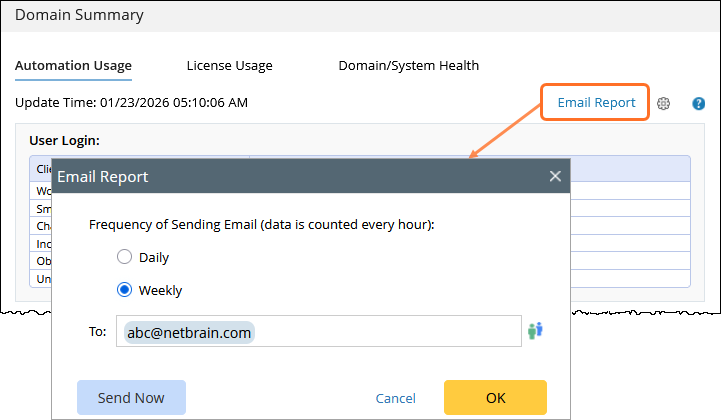
|
|
When automation metrics are included in email notifications, they are presented as text summaries instead of UI blocks. For example:
|
- Click Email Report.
- Define the settings for sending automation usage report via email:
- Frequency of Sending Email: Select a frequency of sending the automation usage report. You can choose to send automation report via email on a daily basis or on a weekly basis.
Note: After you select the frequency of sending email, the last report generated in the day (Daily) or the last report generated in the week (Weekly) will be sent - To: Enter the recipient of the email.
- Frequency of Sending Email: Select a frequency of sending the automation usage report. You can choose to send automation report via email on a daily basis or on a weekly basis.
- Click OK.
Note: You can click Send Now to send the email right now.
The report is generated locally and is not uploaded to the NetBrain license server.
See also: